loon.ggplot

The ggplot2 graphics package (part of the tidyverse package collection) uses the base grid graphics package to produce publication quality graphics for data analysis. Based on a grammar for graphics, ggplot2 also provides a lot of functionality (e.g. facets) that can be extremely useful in data analysis.
The loon graphics package provides interactive graphics especially valuable in any exploratory data analysis. This includes programmatic and direct manipulation of the visualizations to effect interactive identification, zooming, panning, and linking between any number of displays. Of course, loon also provides publication quality static graphics in grid via loon’s functions grid.loon() and loonGrob().
The
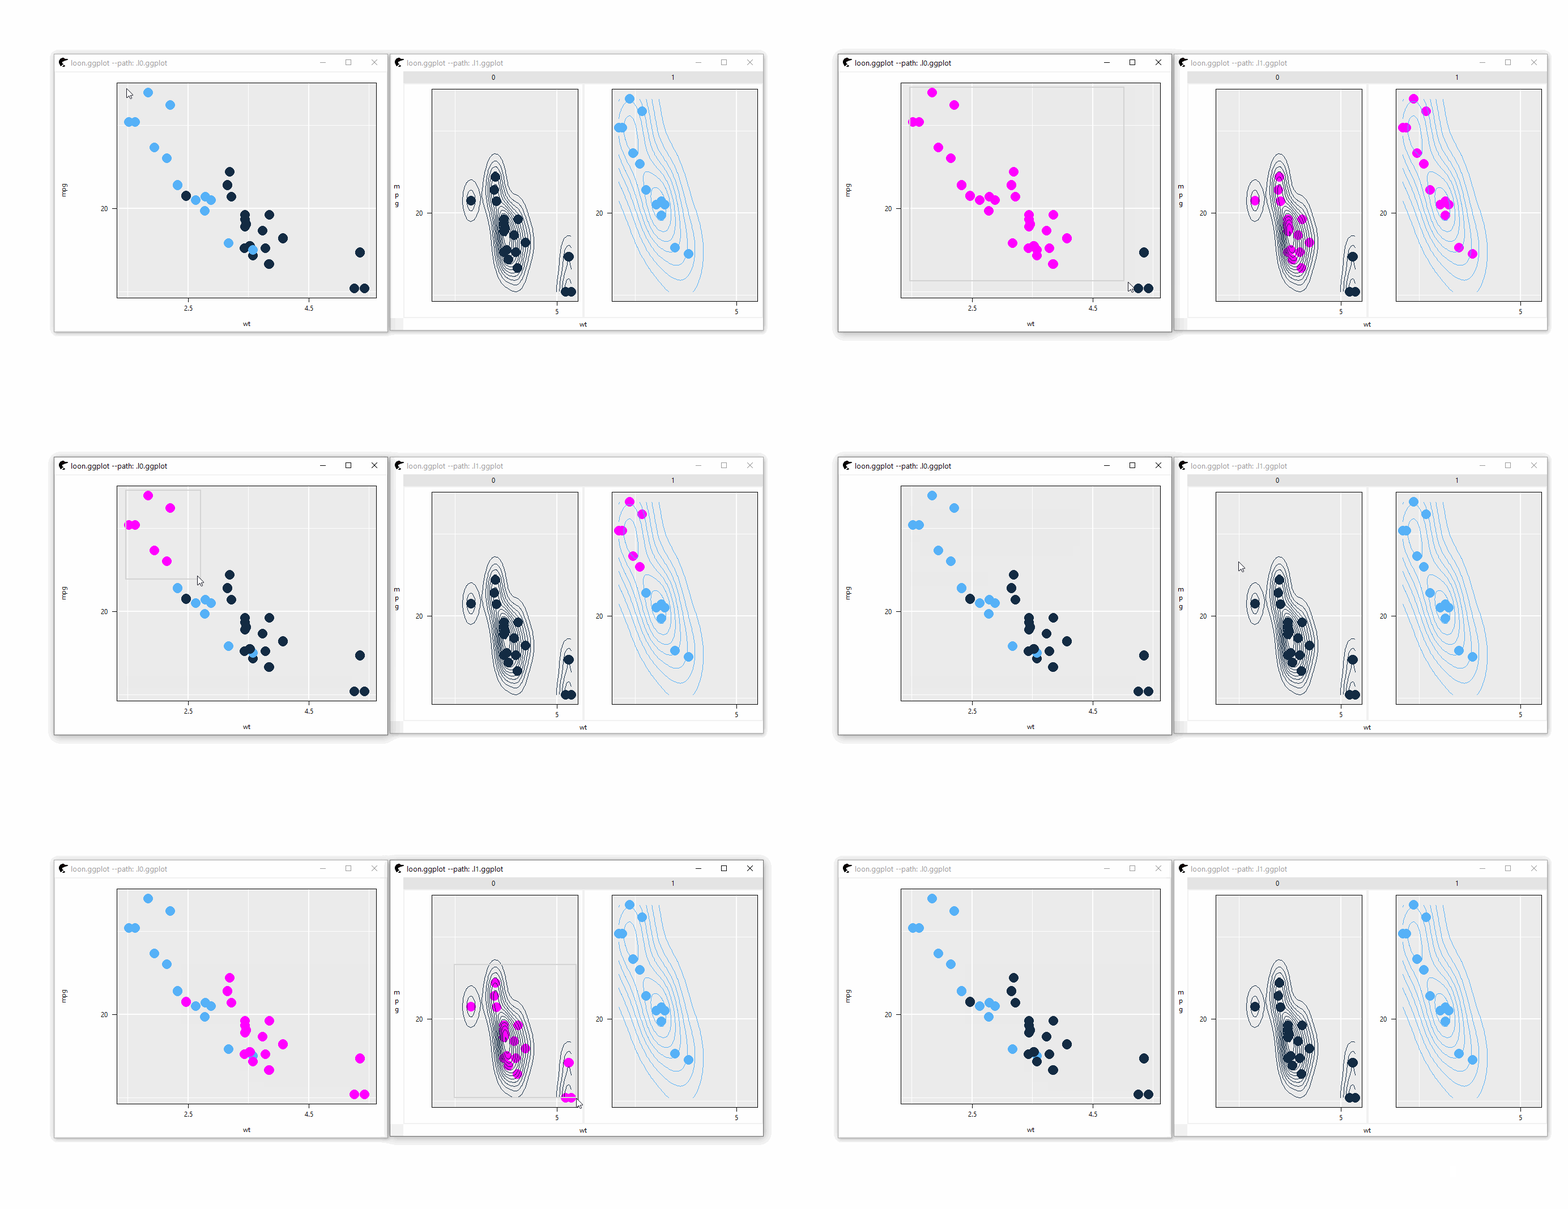
loon.ggplot package brings both these packages together. Data analysts who value the ease with which ggplot2 can create meaningful graphics can now turn these ggplots into interactive loon plots for more dynamic interaction with their data. Conversely, data analysts who explore data interactively can at any time turn a snapshot of their interactive loon plots into ggplots. The former is accomplished by the simple translation function ggplot2loon() and the latter by the simple translation function loon2ggplot().
Try
library(loon.ggplot)
p <- l_ggplot(mtcars, aes(x = wt, y = mpg, col = am)) +
       geom_point(size = 5) +
       linking(linkingGroup = "mtcars")
p
p + geom_density2d() + facet_wrap(vars(am))
